
Learn how to check whether your data follows a distribution with three SciPy tests, Kolmogorov-Smirnov, Anderson-Darling and Shapiro-Wilk, each applied to an open-source dataset with code and results.

Learn how to check whether your data follows a distribution with three SciPy tests, Kolmogorov-Smirnov, Anderson-Darling and Shapiro-Wilk, each applied to an open-source dataset with code and results.

Exploratory data analysis on complex datasets requires tools that reveal deep, hidden patterns, including overlapping distributions and outliers. Open-source Python data visualization libraries like Seaborn can surface such patterns when used effectively, helping you perform high-quality statistical analysis.
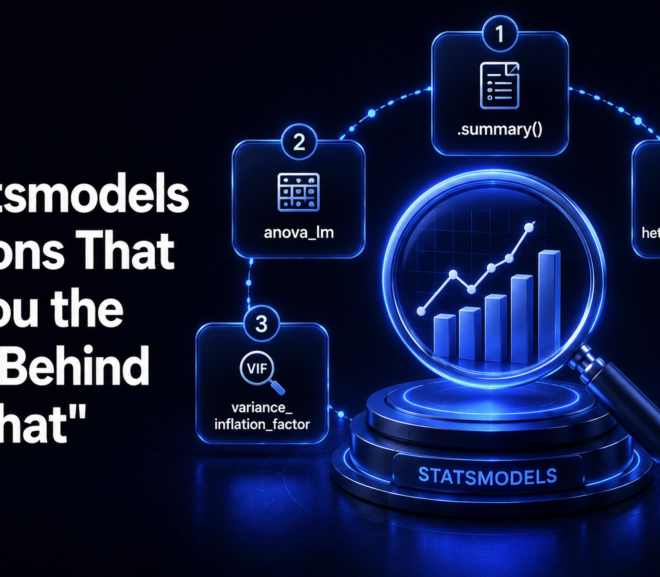
Statsmodels answers the questions sklearn was never built to answer: is this coefficient real or noise, does this added complexity earn its keep, can I trust these p-values in the first place, and which specific data points are quietly running the whole show.

Discovering hidden, multi-dimensional patterns in large datasets doesn’t necessarily demand costly enterprise analytics software if you get acquainted enough with the right open-source tools.

The following seven providers are worth considering in 2026, along with how we compared them.

This article shows three examples of using NumPy array operations — known as vectorized operations — to run simulations like Monte Carlo or Bootstrap models on large datasets nearly instantly.

Learn how to use Python’s statsmodels library to calculate the ideal sample size before collecting data.

Learn how to build a reusable Python script that automatically runs hypothesis tests across all variables in a dataset.

Learn how DoWhy automatically identifies causal estimands using the Lalonde dataset in three steps.
Estimate the Average Treatment Effect in Python using DoWhy with regression and propensity score matching on real data.