
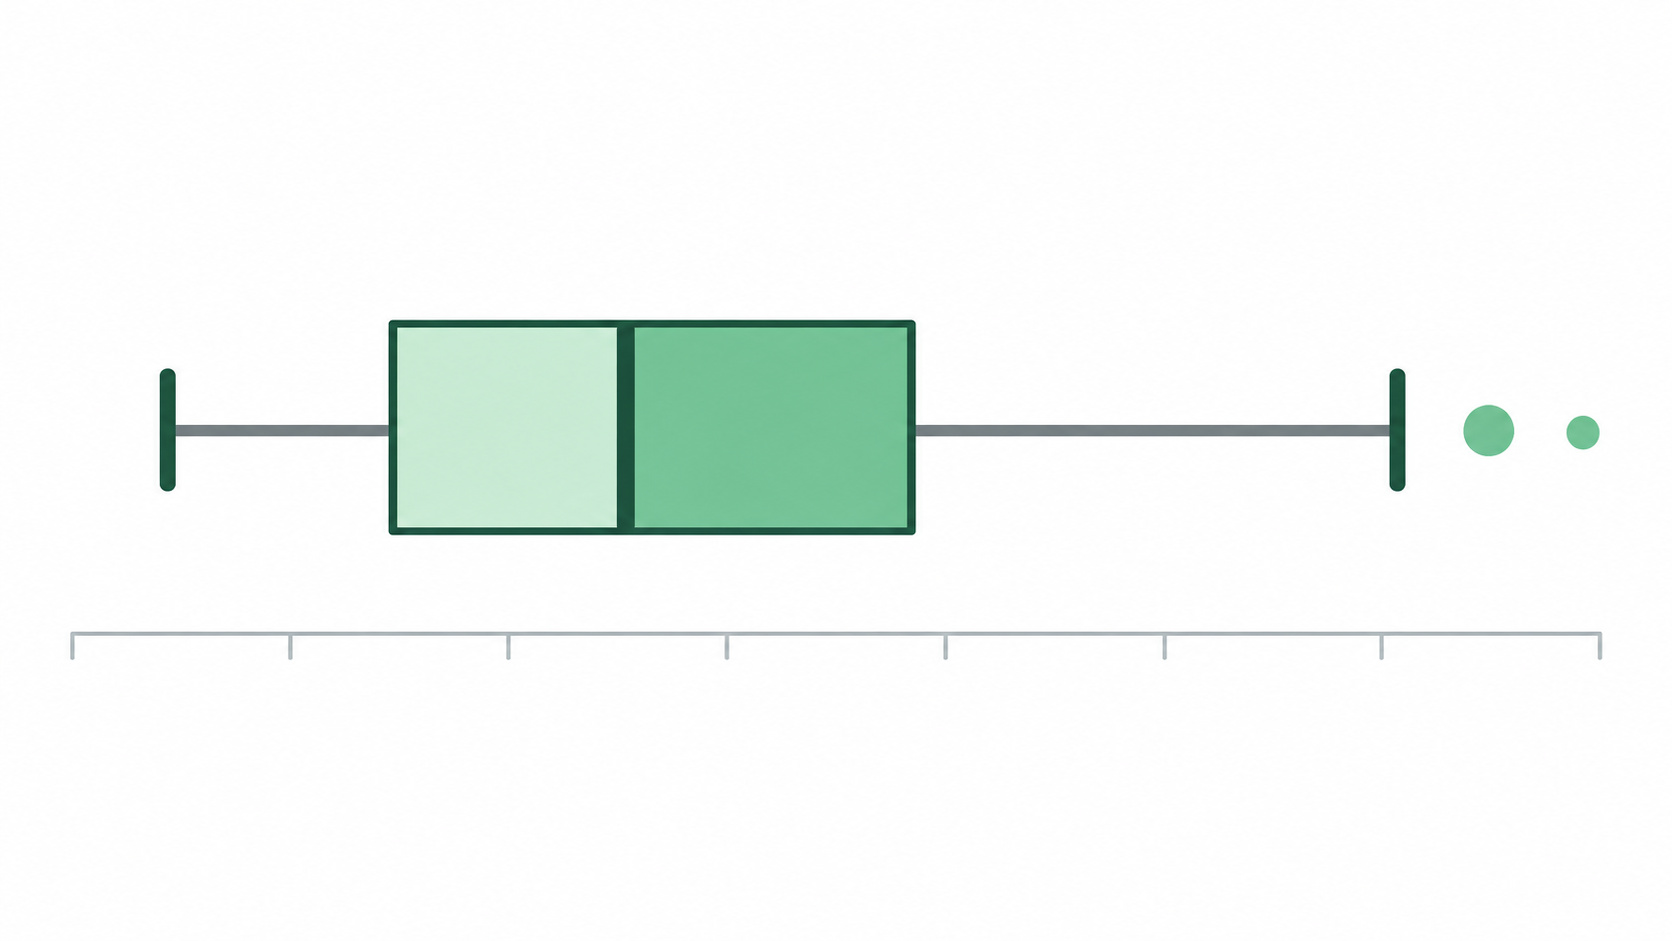
A single chart can tell you a surprising amount about your data, no calculations required. The box plot, also called a box-and-whisker plot, earns its place in descriptive statistics by packing a lot of information into a compact visual. It’s built around five summary statistics: minimum, first quartile (Q1), median, third quartile (Q3), and maximum. Together, these five numbers give you a quick snapshot of how your data is spread out and where the center falls.
But those five numbers are just the starting point. Here’s what you can actually read from a box plot the moment you look at one.
1. Where the Middle of Your Data Falls
The first thing a box plot shows you is the center of your dataset. That vertical line inside the box marks the median, which is the value sitting exactly in the middle of all your observations when sorted from smallest to largest.
Start there when reading any box plot. That single line answers one of the most common questions in data analysis: what does a typical value look like here?
The median is often more useful than the mean for this purpose, because it doesn’t get pulled toward extreme values. Think about household incomes or home sale prices. A handful of very high values can inflate the mean significantly, while the median stays anchored to where most of the data actually sits.
2. How Spread Out the Middle 50% Is
The box itself is the rectangle at the center of the chart. It represents the interquartile range, or IQR, which is the distance between Q1 (the 25th percentile) and Q3 (the 75th percentile), covering roughly the middle 50% of your data.
A wide box means there’s a lot of variability among those middle observations. A narrow box means they cluster tightly together. This matters more than it might seem when you’re comparing groups. Two classes of students might have nearly identical medians on a test, but if one has a wide IQR and the other a narrow one, they have very different levels of consistency. That’s worth knowing.
3. How Far the Data Extends
On each side of the box, lines called whiskers extend outward. They show how far the data stretches beyond the middle 50%, typically reaching the most extreme data point that still falls within 1.5 times the IQR of Q1 and Q3.
Long whiskers on both sides mean the dataset covers a wide overall range. Short whiskers mean the data is more tightly packed from end to end.
The whiskers answer a different question than the box does. The box tells you about the typical middle of the data. The whiskers tell you about the broader territory it covers, right up to the edge of what’s considered the normal range.
4. Whether the Data Is Skewed
One of the subtler things a box plot communicates is the shape of the distribution, specifically whether it leans to one side.
Watch for two things: a whisker that’s noticeably longer than the other, or a median line that sits off-center inside the box. If the median is closer to Q1 and the whisker on the high-value side is longer, most of your values are bunched on the lower end with a tail stretching toward higher values. That’s positive skew. The reverse pattern points to negative skew.
This matters when choosing an analysis method. Many statistical tests assume a roughly symmetric distribution, so a skewed box plot is a quick visual heads-up that those assumptions may not hold.
5. Whether Any Values Are Unusually Extreme
Points plotted individually beyond the whiskers are outliers. These are observations far enough from the rest of the data to be called out separately, rather than folded into the whisker range.
Outliers aren’t automatically bad data. They deserve investigation, not immediate deletion. An unusually low temperature reading in a weather dataset might be a sensor error. An unusually high sale price in a real estate dataset might reflect a genuinely exceptional property. The box plot doesn’t make that call for you, but it makes sure you don’t miss those values, rather than letting them get buried inside a summary statistic.
Why Box Plots Are Worth Learning
In a single figure, a box plot shows you the median, the spread, the skew, and any outliers, all without assuming a particular distribution.
That’s a rare combination for one chart. A bar chart shows counts. A histogram shows frequency. A box plot shows you the shape, center, spread, and anomalies of a distribution all at once, in a form compact enough to stack several side by side for easy comparison.
Once you know how to read one, you’ll start spotting box plots everywhere: research papers, dashboards, data reports across nearly every field. Five simple visual elements. A surprisingly complete picture.
