

Image by Editor
This article explains what Shapley values are and how they can be calculated and used to better understand how data features drive predictions in machine learning models or predictive analysis solutions. We start with a classic statistical view of what Shapley values are, then move toward their recent, AI-focused uses through explainable artificial intelligence (XAI) tools like SHAP. The ultimate goal of this approach is to understand how input data variables influence model predictions.
Shapley Values
When we use predictive models like machine learning systems, we primarily expect to find out what the model predicts for a data example, but not why. However, as models become more powerful and sophisticated, with the ability to perform predictions in complex, sometimes high-stakes scenarios, the model paradoxically becomes more opaque, making it more difficult to understand how its “predictive reasoning” works.
Shapley values were proposed as a principled approach to answer the question: Why did the model make a certain prediction? The method borrows ideas from game theory and adapts them to statistics, treating each input feature or data variable as a “player” that may contribute to the final prediction to some extent. In other words, the prediction is perceived as being “distributed” across all features, depending on how much each feature contributes when acting together (in combination) with the rest of the features.
Formally, the Shapley value for the i-th feature, based on a value function v (known as the characteristic function in cooperative game theory), is calculated as:
\[
\phi_i(v)=\sum_{S\subseteq N\setminus\{i\}}
\frac{|S|!\,(|N|-|S|-1)!}{|N|!}\,
\big(v(S\cup\{i\})-v(S)\big)
\]
In essence, the formula computes the average of a feature’s marginal contributions across all possible subsets of features S. Due to its combinatorial nature, computing it can be expensive for larger feature sets. On the positive side, Shapley values based on this formula have two beneficial properties: consistency and fairness. They are consistent because when a feature acquires more importance in predictions, its assigned value will not decrease. They are also fair because the “credit” each feature obtains is proportional to its actual impact on the prediction.
Shapley values have traditionally been a useful tool for analysts to understand which features primarily drive model outputs, and they provide a practical way to diagnose undesired model results or behaviors. They have been used for decades for relatively opaque models like random-forest and gradient-boosted tree ensembles.
From Shapley Values to Explainable AI (XAI): SHAP
The evolution of machine learning has been largely unstoppable in recent years, with increasingly sophisticated — and often opaque — models, signaling the need for newer and more accessible interpretability tools. This is where recent XAI (explainable artificial intelligence) frameworks like SHAP arose. SHAP stands for SHapley Additive exPlanations, and it encompasses a set of tools that adapt the above Shapley-value method into practical applications involving not only large-scale, cutting-edge predictive models, but also huge real-world datasets. Behind the scenes is a family of algorithms with similar logic to that of the original Shapley values, offered in different modalities while keeping the essential ideas and interpretability-oriented approach.
Through SHAP, we can visualize summary plots, dependence plots, or even the feature contributions and behavior for a single, specific prediction.
This SHAP plot shows, for a set of features that define mobile-phone properties used to predict price, the importance of each feature as well as the type of contribution to predictions — which can be positive (i.e., higher values of the feature may push the prediction upward) or negative (the opposite).
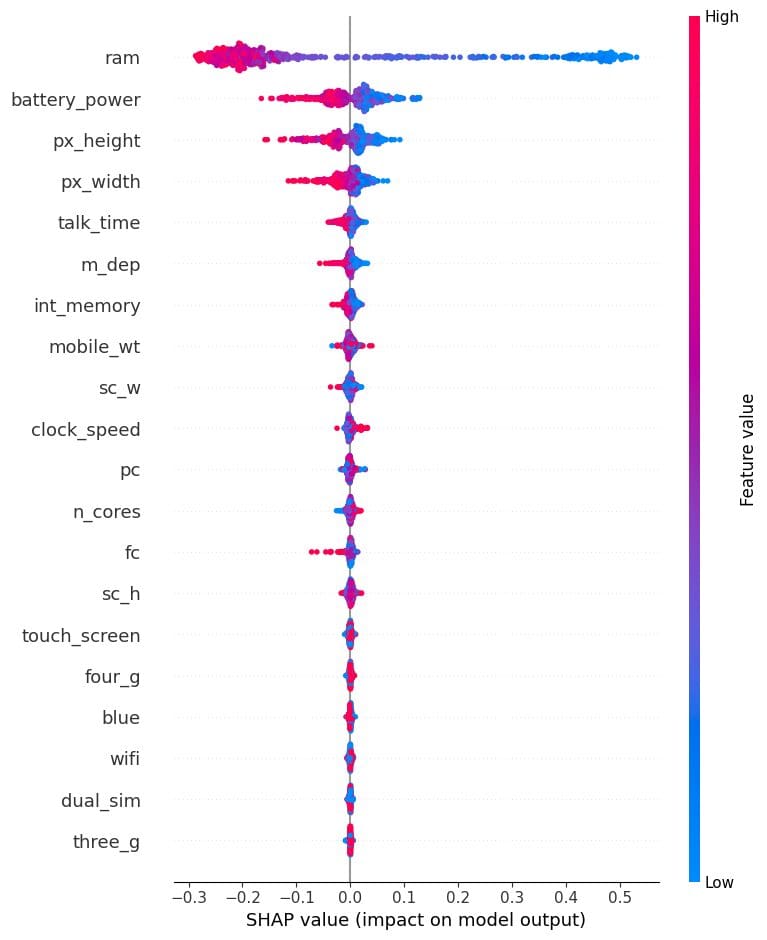 SHAP (SHapley Additive exPlanations) | Image credits: Ali Abid Awan
Meanwhile, this SHAP visualization goes a step further and calculates feature importance and behavior not for the predictive model as a whole, but for a single, specific prediction, illustrating how a set of precise feature values (some particular characteristics of a mobile-phone device) led to a predicted price.
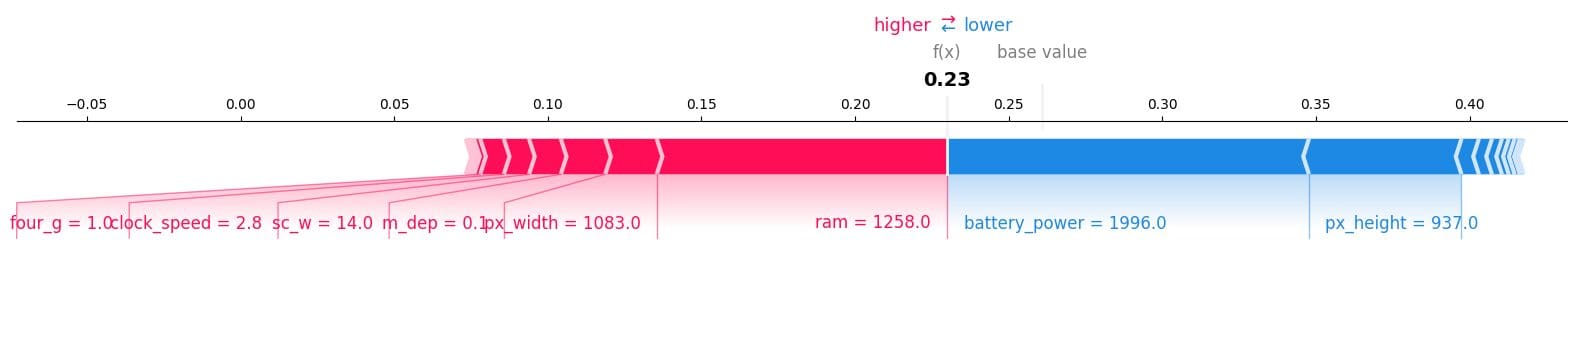 SHAP (SHapley Additive exPlanations) | Image credits: Ali Abid Awan
Final Thoughts
In sum, we have seen how the combination of the ideas behind Shapley values and the use of modern, practical tools for explainable AI, like SHAP, can help us better understand predictive models and how they behave, no matter their complexity.
